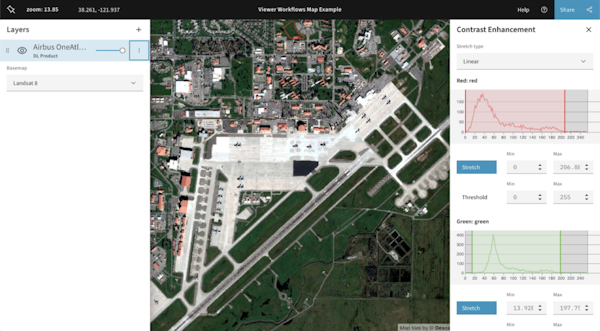
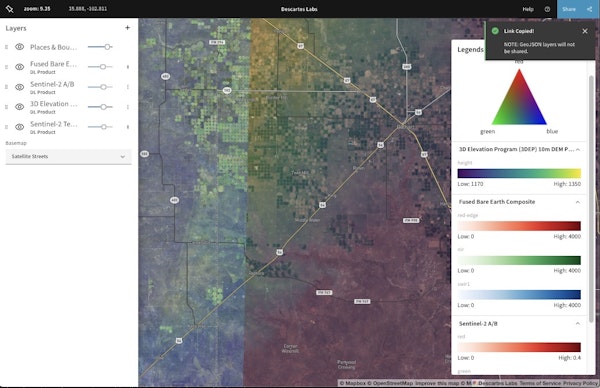
Viewer is a web app that displays proprietary geospatial data from the Descartes Labs catalog. Viewer allows users to more easily adjust contrast of the pixel values of RGB bands based on linear percent, square root, or logarithmic scales and view the results of those updates in real-time.
Working on this project taught me the importance of state management. At its core, the application needed to send state to the Mapbox API, while maintaining a global copy with additional state values for the purposes of storing and saving a map for a user to return to in the future.
Built with React, Redux, Carbon IBM UI components, and Mapbox.